How Bubblemaps Help Track Token Holdings?

The whirlwind of cryptocurrencies continues to swirl and shift nailing down exactly who owns which tokens can feel like chasing shadows—after all, blockchain networks are decentralized and usually pseudonymous by design. That is where bubblemaps come into their own.
This article digs into what bubblemaps are all about and walks you through how they tick and why they’re handy for keeping tabs on token holdings. Whether you’re just dipping your toes into the crypto pool or aiming to sharpen your skills, this guide lays out visualization tools that turn head-scratching blockchain data into something easier on the eyes. We’ll explore how bubblemaps take raw messy data and transform it into clear visual stories. This makes it easy to spot big players, token spread, and lurking risks.
So, What Exactly Are Bubblemaps in Cryptocurrency Anyway
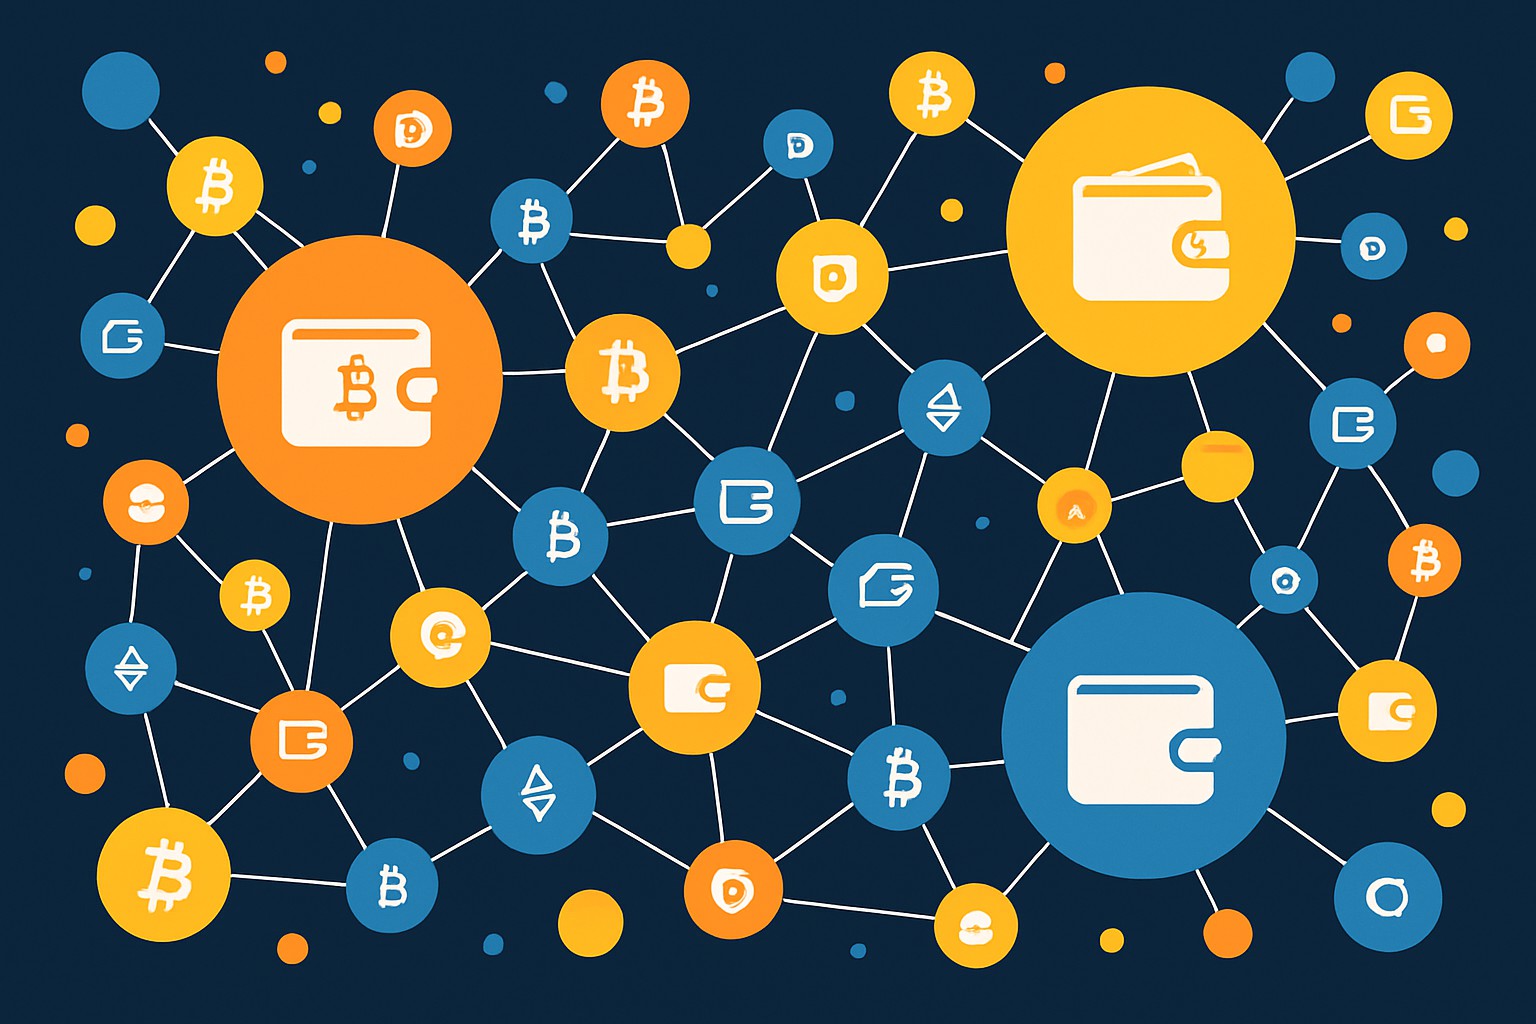
A bubblemaps is a clever way to visualize data using circles known as bubbles that change in size or color to represent different quantities. In the crypto universe these bubbles typically stand for wallet addresses and their size gives you a quick sense of how many tokens each wallet holds.
- The size of each bubble gives you a quick hint at how many tokens a wallet is holding—bigger bubbles mean bigger stakes.
- Colors set different wallet types apart whether it’s exchanges, whales or your everyday individual holders. It’s like a little color-coded party.
- This setup makes it easy to eyeball and compare holdings at a glance and saves you from drowning in numbers.
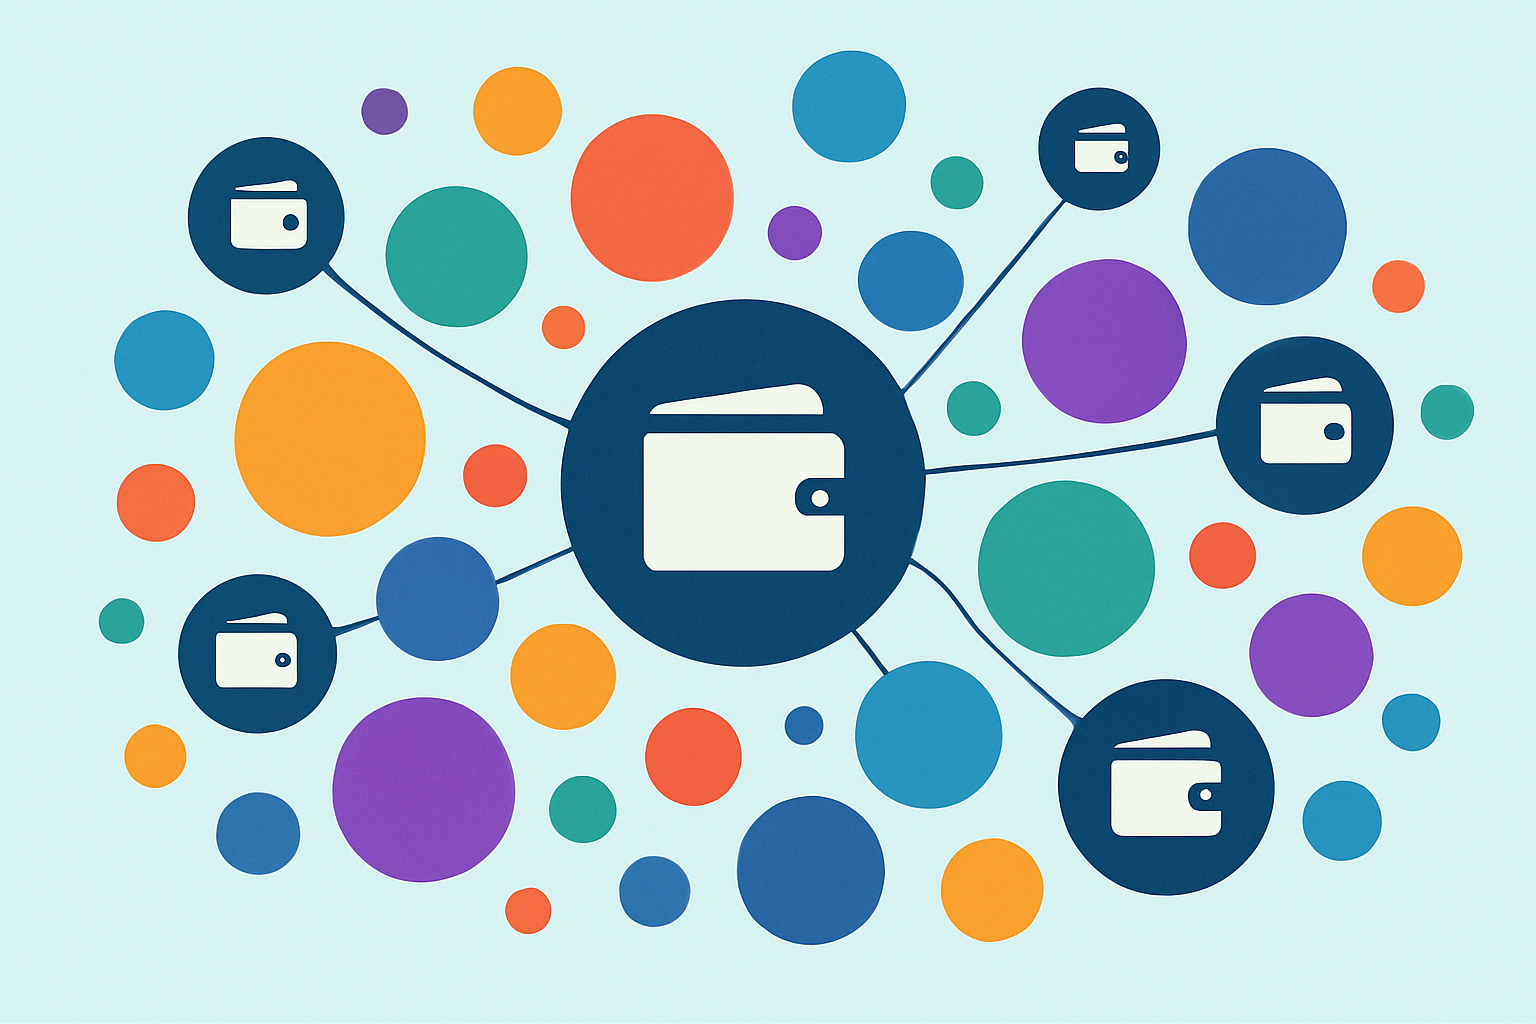
- Wallets that share similar traits tend to cluster together and reveal interesting pockets of ownership.
- Some platforms even step it up a notch with interactive goodies like tooltips or filters letting you dive deeper when you feel like it.
Bubblemaps take the often overwhelming blockchain ledger data and transform it into a neat cluster of bubbles. This makes it much easier for users to spot who’s holding a boatload of tokens and to pick out the big players known as whales. This type of visualization is handy when you want a quick read on decentralization or to flag potential risks from token concentration.
Bubblemaps Step-by-Step Walkthrough
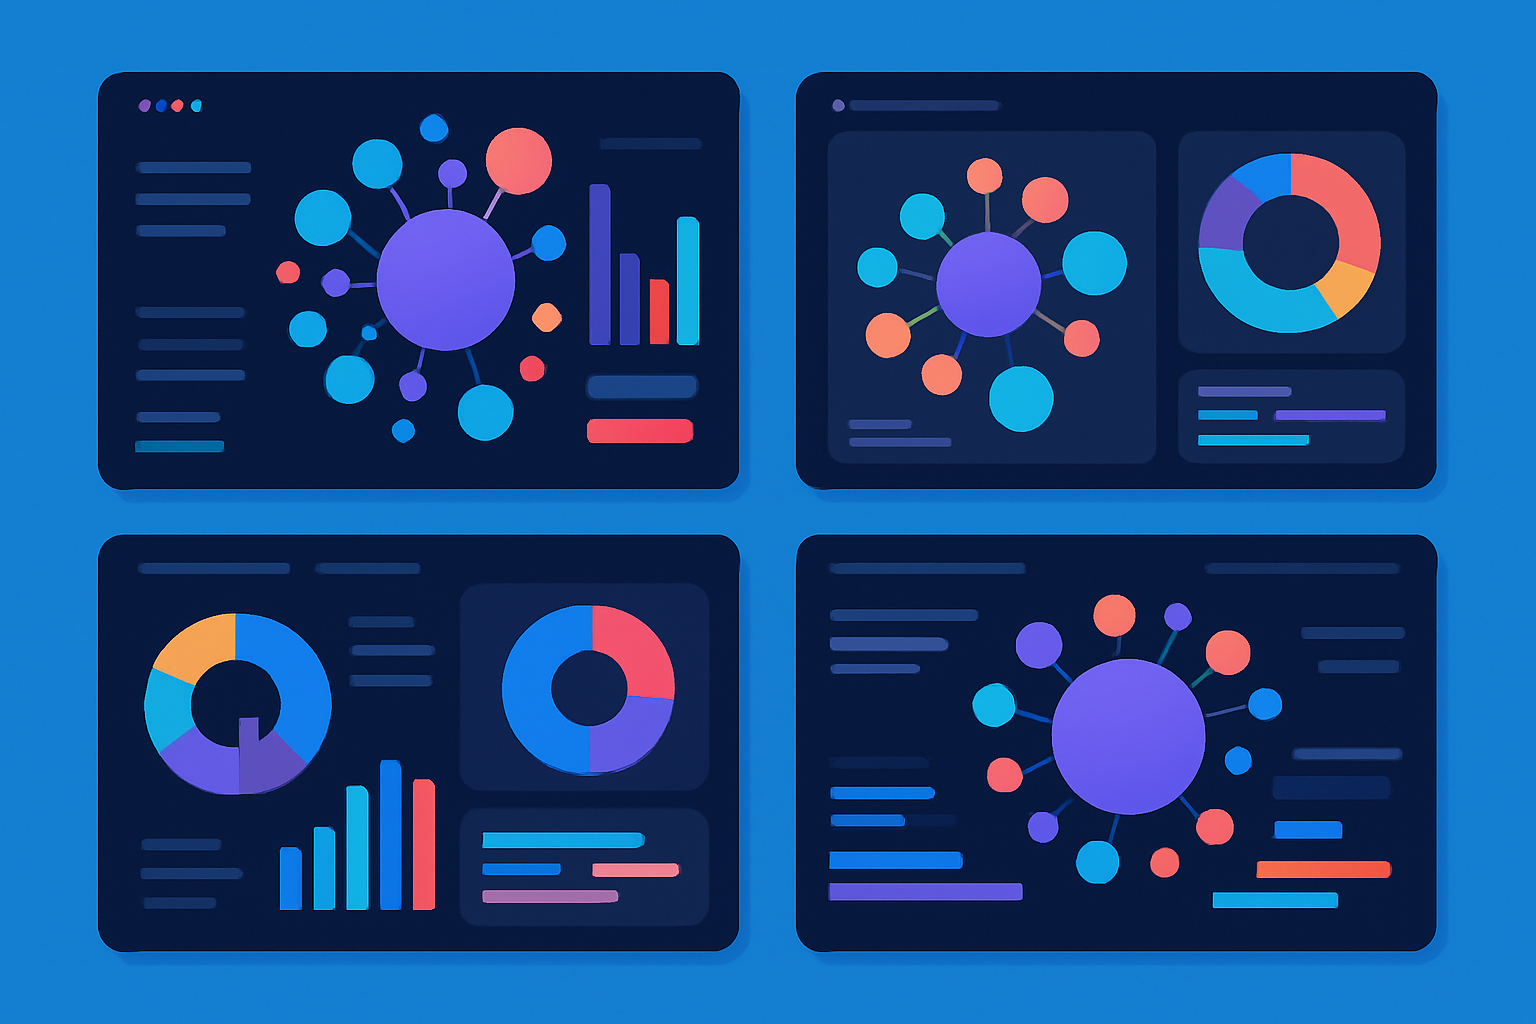
Bubblemaps kick off by grabbing token distribution data right from the blockchain. Each bubble represents a wallet address and its size shows how many tokens are stashed there. Add in clever visual hints like color and grouping and you have got a graphic that layers several levels of insight about wallet types and behavior in one tidy picture.
Gather raw token balance data straight from blockchain explorers or trusty APIs. Think of it as digging through the blockchain’s closet to see what’s inside.
Combine token holdings by wallet to nail down the exact balances because accuracy is key and there’s no room for guesswork.
Set bubble sizes so they reflect the number of tokens each wallet is holding. Bigger bubbles mean bigger fish in this digital pond.
Use colors or clusters to paint a clearer picture of wallet categories like exchanges, early investors or those notorious whales lurking below the surface.
Display the map with interactive features that invite users to dive deeper by hovering over or clicking the bubbles. This makes exploration not just useful but a little fun too.
This step-by-step guide walks users through spotting who really holds the cards and sizing up how decentralized things are. It also catches any unusually big chunks that might sway the token’s market moves and the health of the whole project.
The Importance of Keeping a Close Eye on Token Holdings
Keeping an eye on token holdings gives market participants a clearer picture of how concentrated the supply really is. This can stir up price swings and even security risks. It’s vital to identify those big players often called whales because their moves can send ripples through the market.
- Spot the key whales whose hefty trades often send ripples through the market.
- Keep a close eye on token concentration to size up lurking centralization risks.
- Track token velocity and watch how tokens zip through the network—sometimes it’s quite a dance.
- Assess how decentralized a project’s token distribution really is because appearances can be deceiving.
- Sniff out potential security red flags like large chunks sitting idle in inactive wallets gathering digital dust.
Transforming complex data into clear and easy-to-grasp visuals, bubblemaps help even those who aren’t experts. They make it much simpler to catch the key details about token distribution.
How Bubblemaps Are Used in Crypto (And Why They Matter More Than You Might Think)
Bubblemaps have carved out a pretty important spot in the cryptocurrency world. Investors lean on them to get a clearer picture of portfolio risks. Meanwhile, project teams use these maps to put their transparency on full display. Researchers dive into them to better understand often perplexing tokenomics. On top of that, bubblemaps help track ripple effects of airdrops or mergers and sometimes reveal clustering patterns that hint at consolidated holdings under single entities.
- Help investors get a clear handle on concentration risks and just how diversified their portfolios really are.
- Give projects a chance to showcase genuine decentralization to their communities, and not just talk the talk.
- Spot unusual wallet activity that might be waving a red flag for potential manipulation.
- Verify tokenomics by painting a clear picture of how tokens are spread across holders, no smoke and mirrors.
- Aid regulators and compliance teams in peeling back the layers to uncover ownership structures.
Using bubblemaps really paints a clearer picture of the token landscape. They help cut down the chances of missing those sneaky whale moves or market manipulation tactics, making it easier to steer toward more balanced investment decisions.
Handy Tips and Common Pitfalls for Understanding Bubblemaps
Bubble maps offer great clarity but they have their quirks. Wallet addresses might be clumped together, totally inactive or part of exchanges juggling tokens for many users.
- Keep an eye out if those large bubbles represent exchanges because they can sometimes hide a crowd of users underneath.
- Don’t forget about token lock-up or vesting periods that may restrict immediate transfers.
- Take a look at wallet activity to distinguish dormant holders from those actually moving coins around.
- Make a mental note of when the data snapshot was taken since timing can make all the difference.
- Remember that not every big holder has the same kind of market influence, as some might be limited by selling restrictions.
Keeping these points in mind really helps users approach bubblemaps with a bit more care and thought, so they’re more likely to come away with solid insights instead of getting hoodwinked by flashy visuals or incomplete data.
Common Platforms and Tools That Really Bring Bubblemaps to Life
Many blockchain analytics platforms these days come equipped with bubblemaps or something along those lines—visual tools that make diving into token holdings a bit more intuitive. Nansen often steals the spotlight thanks to its hefty dataset and neatly detailed wallet categorization. Dune Analytics gives users the freedom to roll up their sleeves and craft custom maps by writing their own SQL queries, which is pretty neat if you like tinkering under the hood.
| Platform | Bubblemaps Availability | Key Features | Cost | User Friendliness | Data Update Frequency |
|---|---|---|---|---|---|
| Nansen | Yes | Deep-dive wallet categorization, ERC-20 analytics, plus whale tracking that keeps you in the know | Paid | Best for those with some experience | Real-time |
| Dune Analytics | Yes (customizable) | Run SQL queries, explore community-built dashboards, and whip up custom visualizations to your liking | Free/Paid | Moderate comfort level | Nearly real-time |
| Etherscan | Basic visualizations | Handy lists of token holders and quick snapshots of token distribution—perfect for beginners | Free | Friendly for newcomers | Updated on the regular |
| Glassnode | No direct bubblemaps, but plenty of rich on-chain data and visuals to dig into | Paid | Tailored for seasoned users | Real-time | |
| CoinGecko | Some visualizations | Token metrics and info on holder distribution that’s easy to digest | Free | Great for beginners | Updated frequently |
Picking the right platform really comes down to what you need—things like how tech-savvy you are and how deep you want to dive into the data. Of course, your budget matters too. For casual users just dipping their toes, free tools like Etherscan or CoinGecko usually do the trick without any fuss.
The Future of Bubblemaps and Visualizing Token Holdings A Closer Look at What’s Next
As blockchain ecosystems churn out ever-growing volumes of data, the appetite for slick visualization tools like bubblemaps naturally swells. The next wave of improvements usually sets its sights on real-time updates powered by AI, enabling quick-on-the-draw insights that can keep pace with the market’s fast twists and turns.
One emerging trend that is really catching on is the use of 3D visualizations and bubblemaps, which add a whole new layer of depth and fresh perspectives to token distributions across multiple dimensions. By pulling data from various blockchains, these tools try to serve up cross-chain analytics all wrapped up in one neat package. On top of that, improved interactivity through filtering and scenario simulation lets users dig into token holdings with way more detail than ever before.
Visual tools like bubblemaps are truly changing the game when it comes to understanding blockchain data. They take those overwhelming, tangled numbers and turn them into clear, bite-sized insights that help both institutional investors and retail traders navigate a fast-moving market with a bit more confidence. It’s not just data—it’s telling a story, and in my experience, that makes all the difference. — Crypto Analyst Jane Doe
Frequently Asked Questions
How accurate are bubblemaps, and can they be misleading?
Bubblemaps are definitely handy but can sometimes lead you down the garden path if you don’t have the full context. For instance, a big bubble might look like a massive whale holding tons of tokens when it’s just a major exchange holding tokens for thousands of users. It’s like mistaking a crowd for a single giant. That’s why it’s super helpful if the platform labels wallets by type like 'exchange' or 'vesting' and always worth double-checking when the data was last refreshed so you get the clearest picture of who’s really holding what.
Are there any free tools to create or view bubblemaps?
Absolutely you don’t always have to dig into your wallet for these. For starters, Etherscan offers straightforward token holding distribution charts for many Ethereum tokens. It’s like the classic map you pull out to get your bearings. If you want something fancier and more interactive, platforms like Dune Analytics let you build custom visuals. Fair warning, their SQL-based system can feel like learning a new language at first but once you get the hang of it it is pretty rewarding.
What is the difference between a whale and an exchange wallet on a bubblemap?
Good bubblemaps make this easy by using color-coding to separate the two. A whale is one hefty token holder who can really move the market if they choose—think of them as the big fish in the pond. An exchange wallet is more like a big communal jar pooling tokens from countless users so its size doesn’t mean one person is calling the shots. Grasping this difference is vital when sizing up risk and trying to keep your head above water.
Can bubblemaps help me avoid scam or risky cryptocurrency projects?
Definitely. If you see just a handful of wallets clutching most of the tokens that’s a big red flag. This kind of heavy concentration amps up the risk of price manipulation and can spell trouble down the line. Bubblemaps are a fantastic shortcut to spot risky centralization early so you don’t end up caught with your pants down when things go south.
Do bubblemaps show real-time data?
It depends on the platform you’re using. Most bubblemaps are based on snapshots of blockchain data so they don’t update in real-time. Some fancier paid tools like Nansen give you more frequent refreshes but those usually come with a price tag. So it’s always a good idea to check the 'last updated' timestamp on whatever tool you lean on to make sure you’re not looking at yesterday’s news.

Start Your Crypto Journey with Coinbase Today
Ready to enter the cryptocurrency market but unsure where to begin? Coinbase makes buying, selling, and storing digital assets simple and secure for beginners and experts alike.